Spring Boot Actuator
本文将介绍如何使用 SpringBoot Actuator 对 SpringBoot 应用进行监控。
一、什么是 Actuator ?
Spring Boot Actuator是Spring Boot提供用于对应用系统进行自省和监控的功能模块,基于此开发人员可以方便地对应用系统某些监控指标进行查看、统计、审计、指标收集等。Actuator提供了基于Http端点或JMX来管理和监视应用程序。
简单来说,SpringBoot Actuator 是 SpingBoot 的一套监控框架,能够监控 SpringBoot 应用。
二、API 接口
Actuator 提供了一系列接口,用于查看 SpringBoot 应用程序的各种信息。
Actuator 接口分为三大类:
- 应用配置类:指 SpringBoot 应用的的配置信息
- 度量指标类:指运行时的动态信息,用于监控
- 操作控制类:提供了操作类功能,例如 shutdown 可以用于关闭 SpringBoot 应用程序
具体接口如下表:
| HTTP 方法 | 路径 | 描述 |
|---|---|---|
| GET | /auditevents | 显示应用暴露的审计事件 (比如认证进入、订单失败) |
| GET | /beans | 描述应用程序上下文里全部的 Bean,以及它们的关系 |
| GET | /conditions | 就是 1.0 的 /autoconfig ,提供一份自动配置生效的条件情况,记录哪些自动配置条件通过了,哪些没通过 |
| GET | /configprops | 描述配置属性(包含默认值)如何注入Bean |
| GET | /env | 获取全部环境属性 |
| GET | /env/{name} | 根据名称获取特定的环境属性值 |
| GET | /flyway | 提供一份 Flyway 数据库迁移信息 |
| GET | /liquidbase | 显示Liquibase 数据库迁移的纤细信息 |
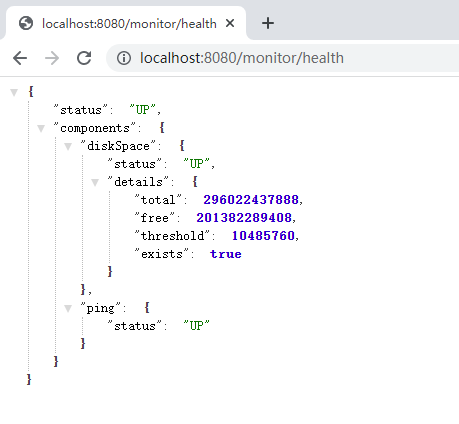
| GET | /health | 报告应用程序的健康指标,这些值由 HealthIndicator 的实现类提供 |
| GET | /heapdump | dump 一份应用的 JVM 堆信息 |
| GET | /httptrace | 显示HTTP足迹,最近100个HTTP request/repsponse |
| GET | /info | 获取应用程序的定制信息,这些信息由info打头的属性提供 |
| GET | /logfile | 返回log file中的内容(如果 logging.file 或者 logging.path 被设置) |
| GET | /loggers | 显示和修改配置的loggers |
| GET | /metrics | 报告各种应用程序度量信息,比如内存用量和HTTP请求计数 |
| GET | /metrics/{name} | 报告指定名称的应用程序度量值 |
| GET | /scheduledtasks | 展示应用中的定时任务信息 |
| GET | /sessions | 如果我们使用了 Spring Session 展示应用中的 HTTP sessions 信息 |
| POST | /shutdown | 关闭应用程序,要求endpoints.shutdown.enabled设置为true |
| GET | /mappings | 描述全部的 URI路径,以及它们和控制器(包含Actuator端点)的映射关系 |
| GET | /threaddump | 获取线程活动的快照 |
三、简单使用
1. 添加依赖
在 pom.xml 中添加:
1 | |
2. 配置
在配置文件中添加配置信息如下:
1 | |
3. 获取信息